CI Topology View
Overview
CI Topology View is a "query-definition"-driven global topology visualization module. It renders the queries you design in Query Studio directly into an interactive CI relationship network — letting you see, from a business perspective, how various CIs are connected.
Unlike the "Configuration Topology" tab in the CI Directory — which starts from a single CI to view its upstream and downstream neighbors — CI Topology View starts from a set of CIs (a query definition) to display the entire relationship network at once. It is ideal for global impact analysis, architecture reviews, and topology inspections.
What this module helps you do:
- See a complete relationship topology from a query — no code required
- See connections across different CI types on the same graph (for example, "which applications run on which servers")
- Explore outward from any node, appending related CIs layer by layer as needed
- Switch to Table View in one click when there are too many nodes — review and export instance data as a list
Key Features
- Query-driven: The left tree lists all query definitions grouped by resource group; click to render the corresponding CI topology
- Dual view modes: Graph View for the CI network, Table View for instance details — one-click switch
- Explore Mode: Start from any node and filter or append related CIs by type to progressively expand the topology
- Relationship editing: Link existing CIs, create new related CIs, or delete relationships directly on the graph
- Multiple layouts: Vertical Hierarchical, Horizontal Hierarchical, Force-Directed, and Concentric auto-layout algorithms
- Fullscreen and Export: Immersive fullscreen viewing; export the topology as a PNG image
Interface Layout
CI Topology View uses a left-right split layout: on the left is the query-definition navigation tree, and on the right is the topology visualization area for the selected query.
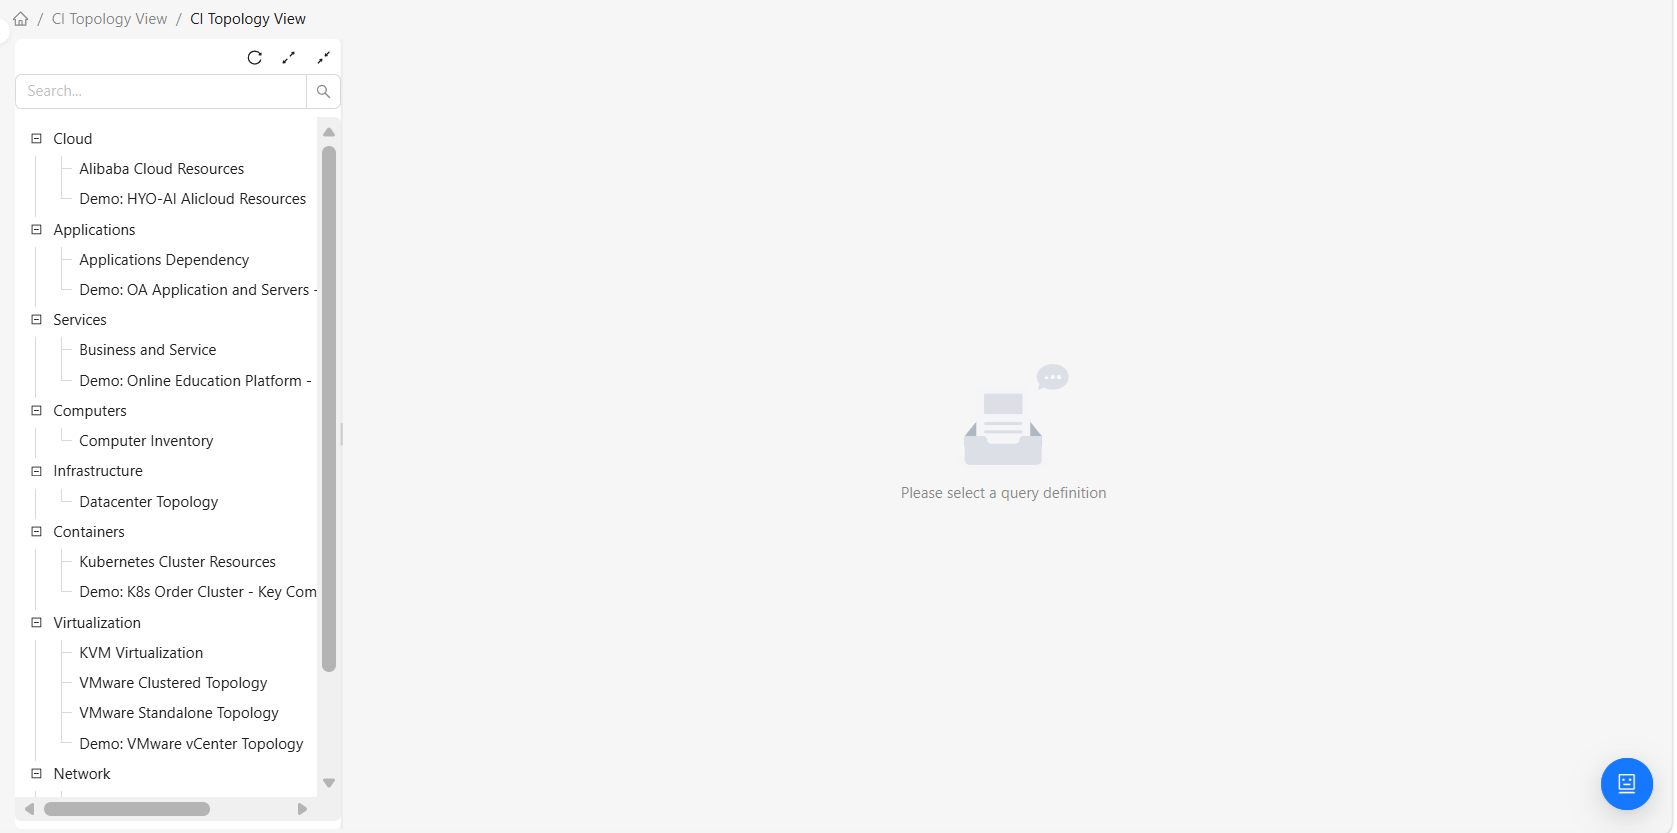
Left: Query Definition Navigation Tree
The left navigation tree lists all available query definitions in the system, organized by resource group:
- Group nodes: The resource group a query definition belongs to — for example, "Default Group" or "Network Devices". Click a group node to expand/collapse its queries
- Query nodes (leaf nodes): Specific query definitions — for example, "Production Application Topology" or "All Databases and Hosts". Click a query node to render the corresponding CI topology on the right
The top of the tree provides:
- Search box: Quickly filter query definitions by name
- Refresh button: Re-fetch the query-definition list (after creating or editing a query in Query Studio, click here to make the new query appear in the tree)
Right: Topology Visualization Area
The right area shows different content depending on whether a query is selected and on the current view mode:
| State | Displayed content |
|---|---|
| No query selected | "Please select a query definition." |
| Query selected (Graph mode) | CI relationship graph (default) |
| Query selected (Table mode) | Query definition graph + CI instance list |
At the top of the right pane is a view-mode switch (Graph / Table) for toggling between the two views.
How to Use
Select a Query to View the CI Topology
- In the left navigation tree, expand the resource group that contains the target query
- Click the query node (for example, "Production Application Topology")
- The right pane automatically loads the query and renders the corresponding CI topology
- The browser address bar updates to a dedicated link for this query — convenient for bookmarking or sharing with colleagues
If you just created a query in Query Studio but cannot see it in the left tree, click the "Refresh" button at the top of the navigation tree.
Search Query Definitions
When the number of queries grows large:
- Enter a keyword from the query name into the search box at the top of the left navigation tree
- The tree filters automatically, keeping only the queries whose names contain the keyword
- Clear the search box to restore the full list
Switch Between Graph and Table Views
At the top of the right pane is a switch with "Graph" on one end and "Table" on the other:
- Switch to Graph: Displays the relationship network — ideal for surveying the overall structure → see Graph View
- Switch to Table: Displays the query-definition graph + instance list — ideal for reviewing and exporting instance data row by row → see Table View
When the topology data exceeds the system-configured maximum-node limit (default 500), the system recommends switching to Table View for better performance.
View Modes Overview
Graph View
The CI topology is displayed as nodes and edges. Each node represents a CI instance, and the node icon uses the icon of the corresponding CI type; each edge represents a relationship between CIs. Suitable for relationship reviews, impact analysis, and architecture browsing.
→ For detailed operations, see Graph View
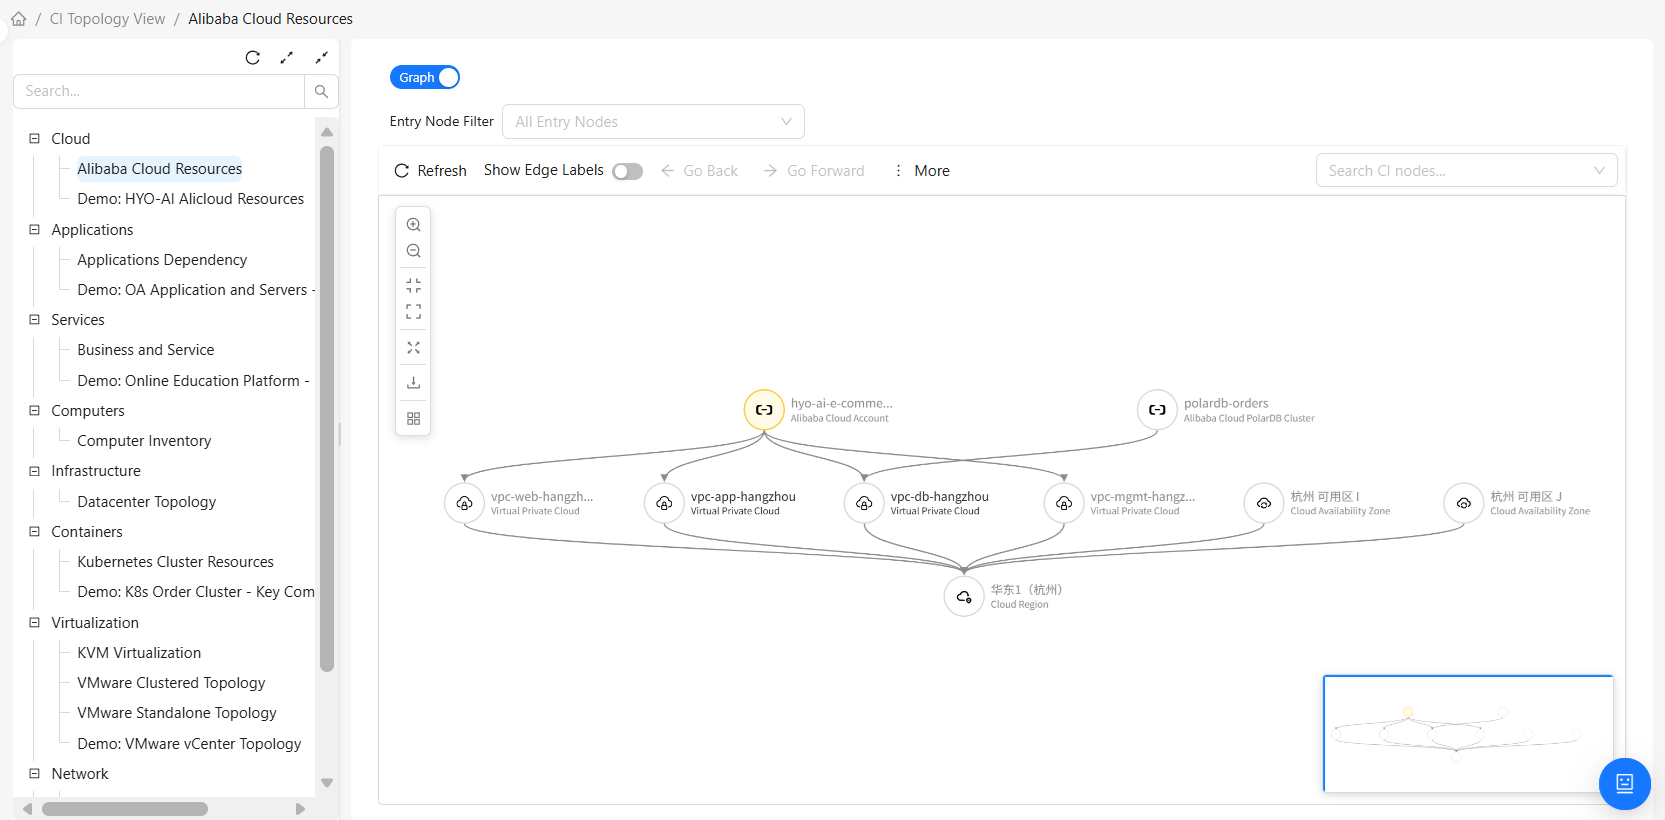
Table View
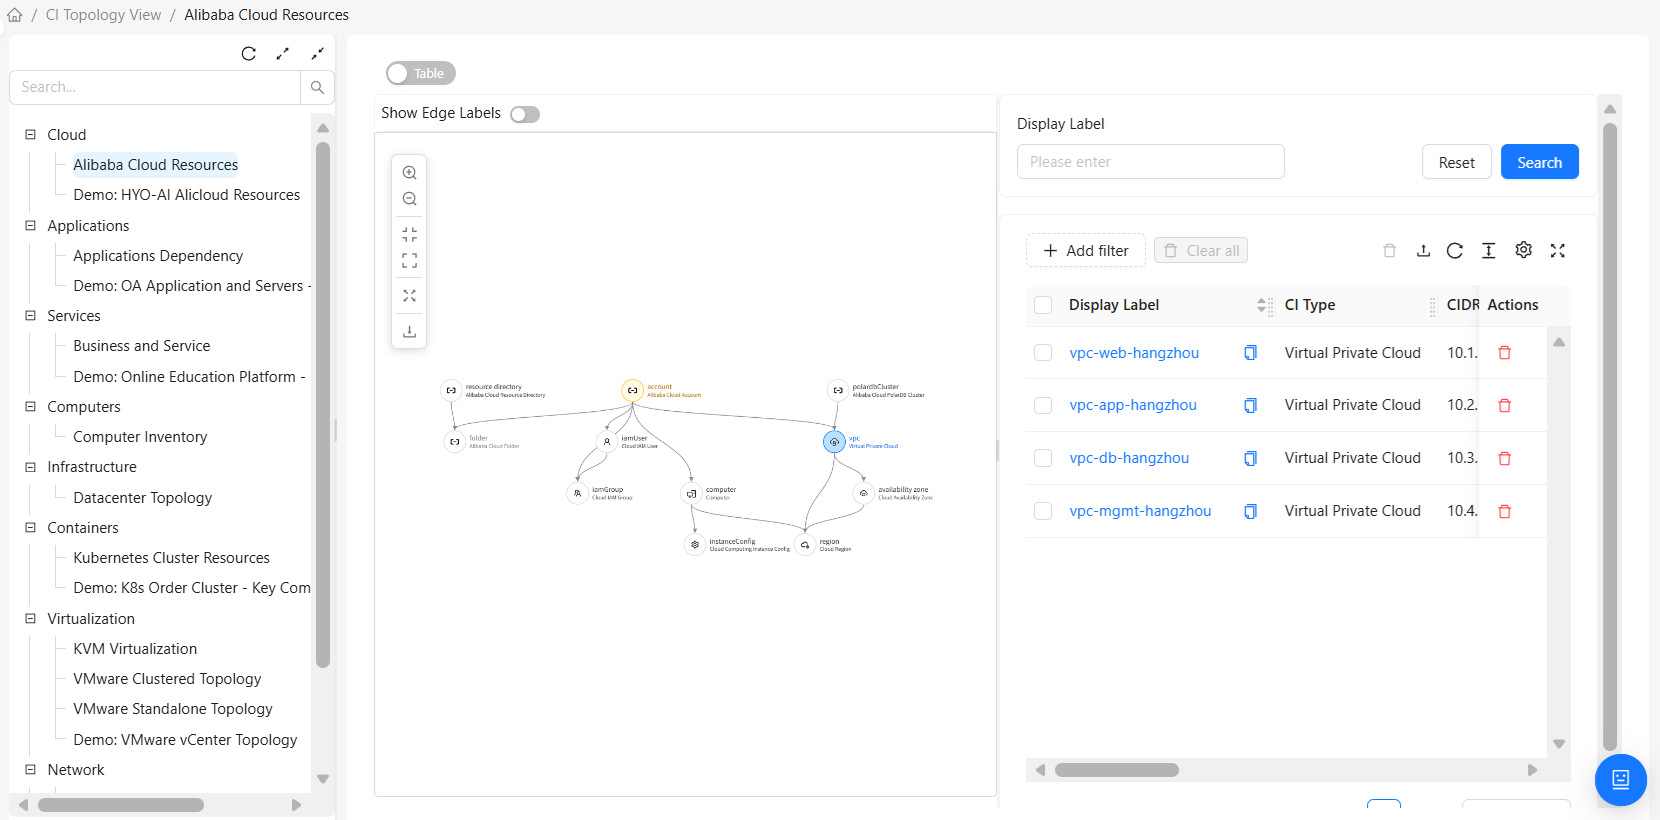
Split left/right: on the left is the definition graph of the query (showing which type nodes and relationships the query contains); on the right is the list of CI instances for the selected type node. Suitable for precisely reviewing each CI type's attribute data, with export support.
→ For detailed operations, see Table View
Permissions
The visibility of CI Topology View is controlled by the UI permission CI Topology View. Only users with this menu permission can see and enter "CI Topology View" in the navigation.
Once on the page, editing operations on the graph are additionally governed by fine-grained permissions on the CI resource (CI):
| Permission | Allowed operations |
|---|---|
| Read-only access | Browse the topology, switch views, search nodes, view node/relationship details, export images, export instance data |
| Full access | In addition to the above: "Link Existing CI", "Create Related CI", "Delete Relationship", and other create/update/delete operations on CIs |
If you cannot see the "Link Existing CI", "Create Related CI", or "Delete" buttons, your current account does not have full access. Please contact your system administrator.